Plugin description
UI overview
Main UI elements of the plugin are:
- Status bar icons, they show connection status and verbose mode option
UTBot consoles, a window to show logs from server (GTest log, Server log) and plugin (Client log)UTBot targets, a window to show targets found by server in current projectUTBot Source Directories, a view to show source directories marked green

Tests generation
You can trigger tests generation in multiple ways:
From editor context menu. For example, right click in editor and choose
UTBot Generate Tests... for File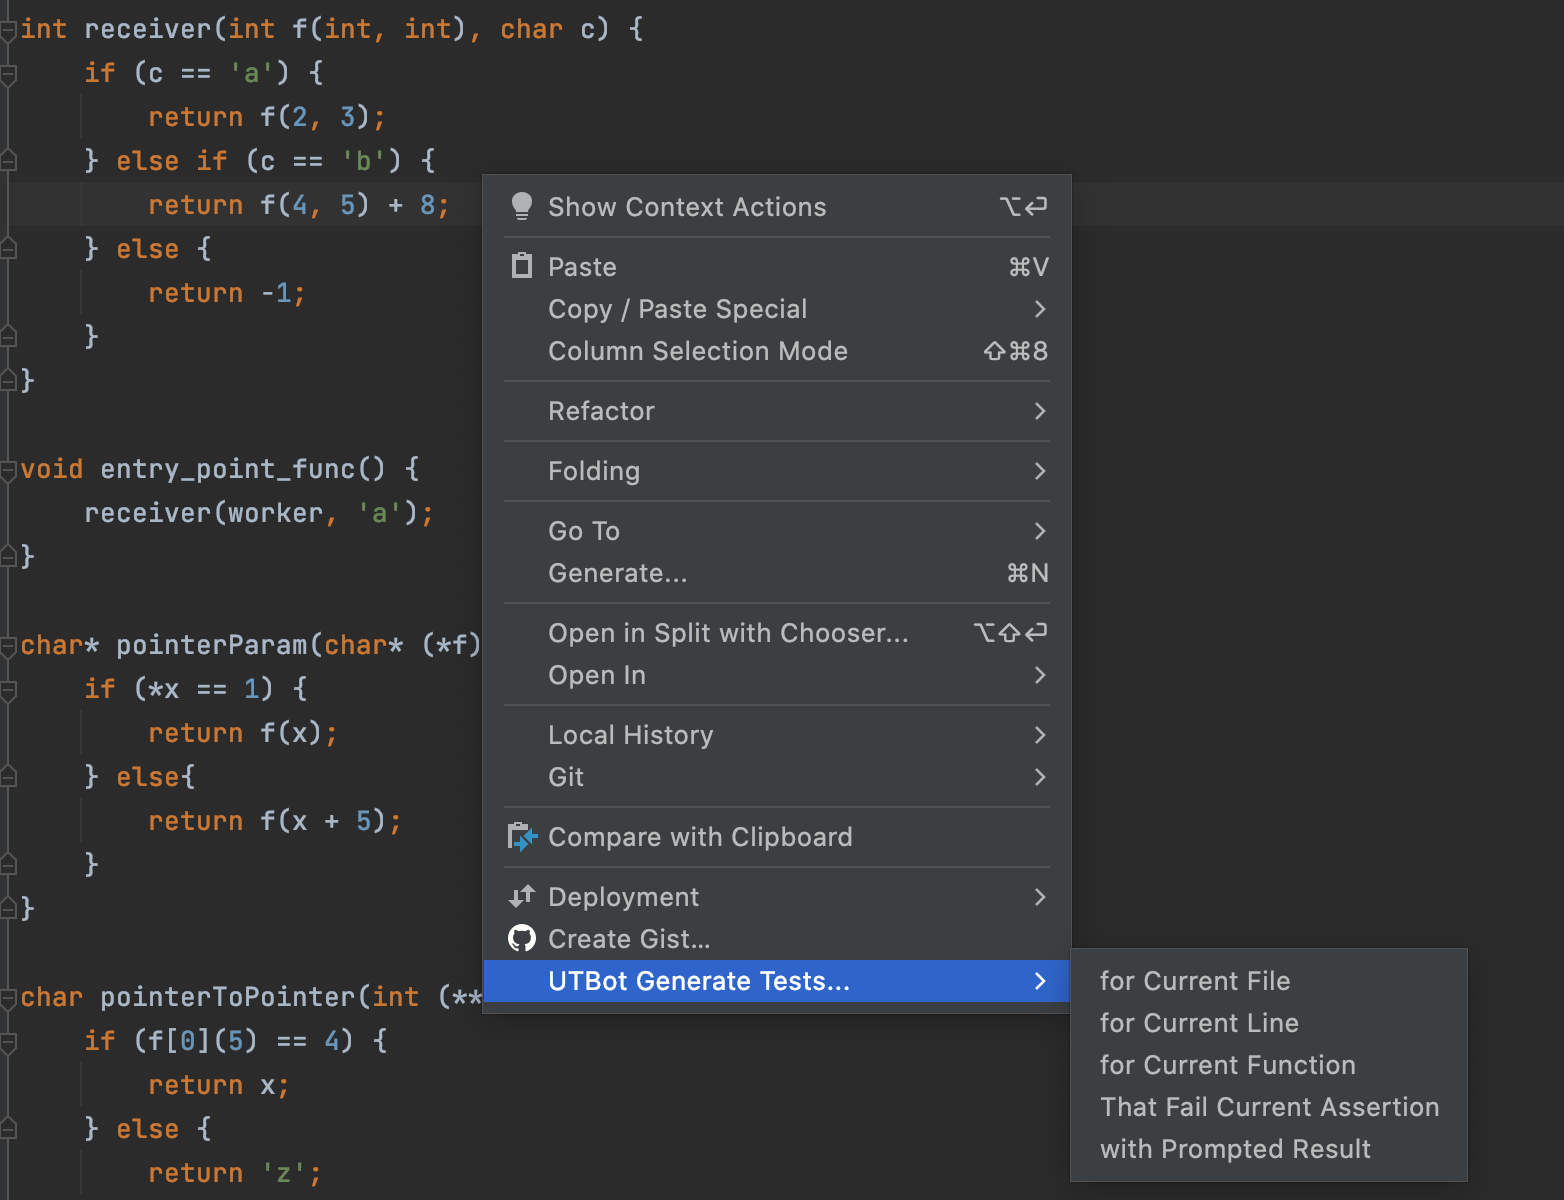
From project view context menu. For example, right click on file in project view and choose:
UTBot: Generate Tests For Folder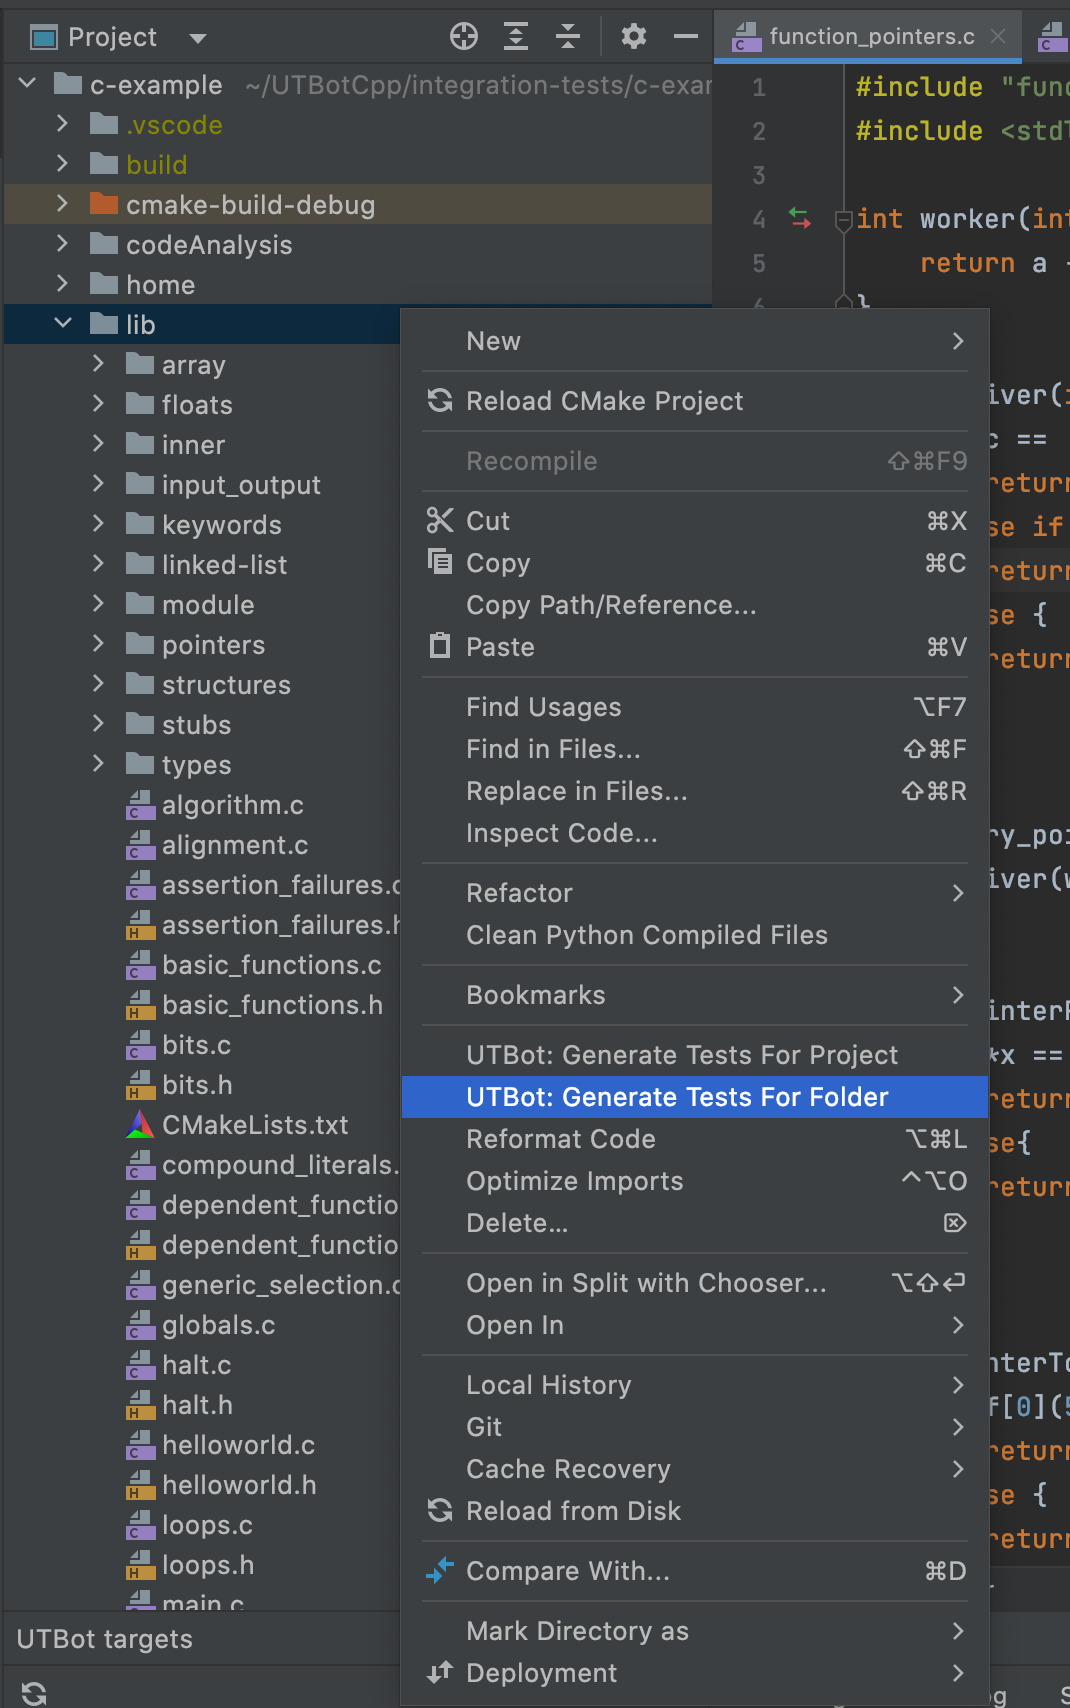
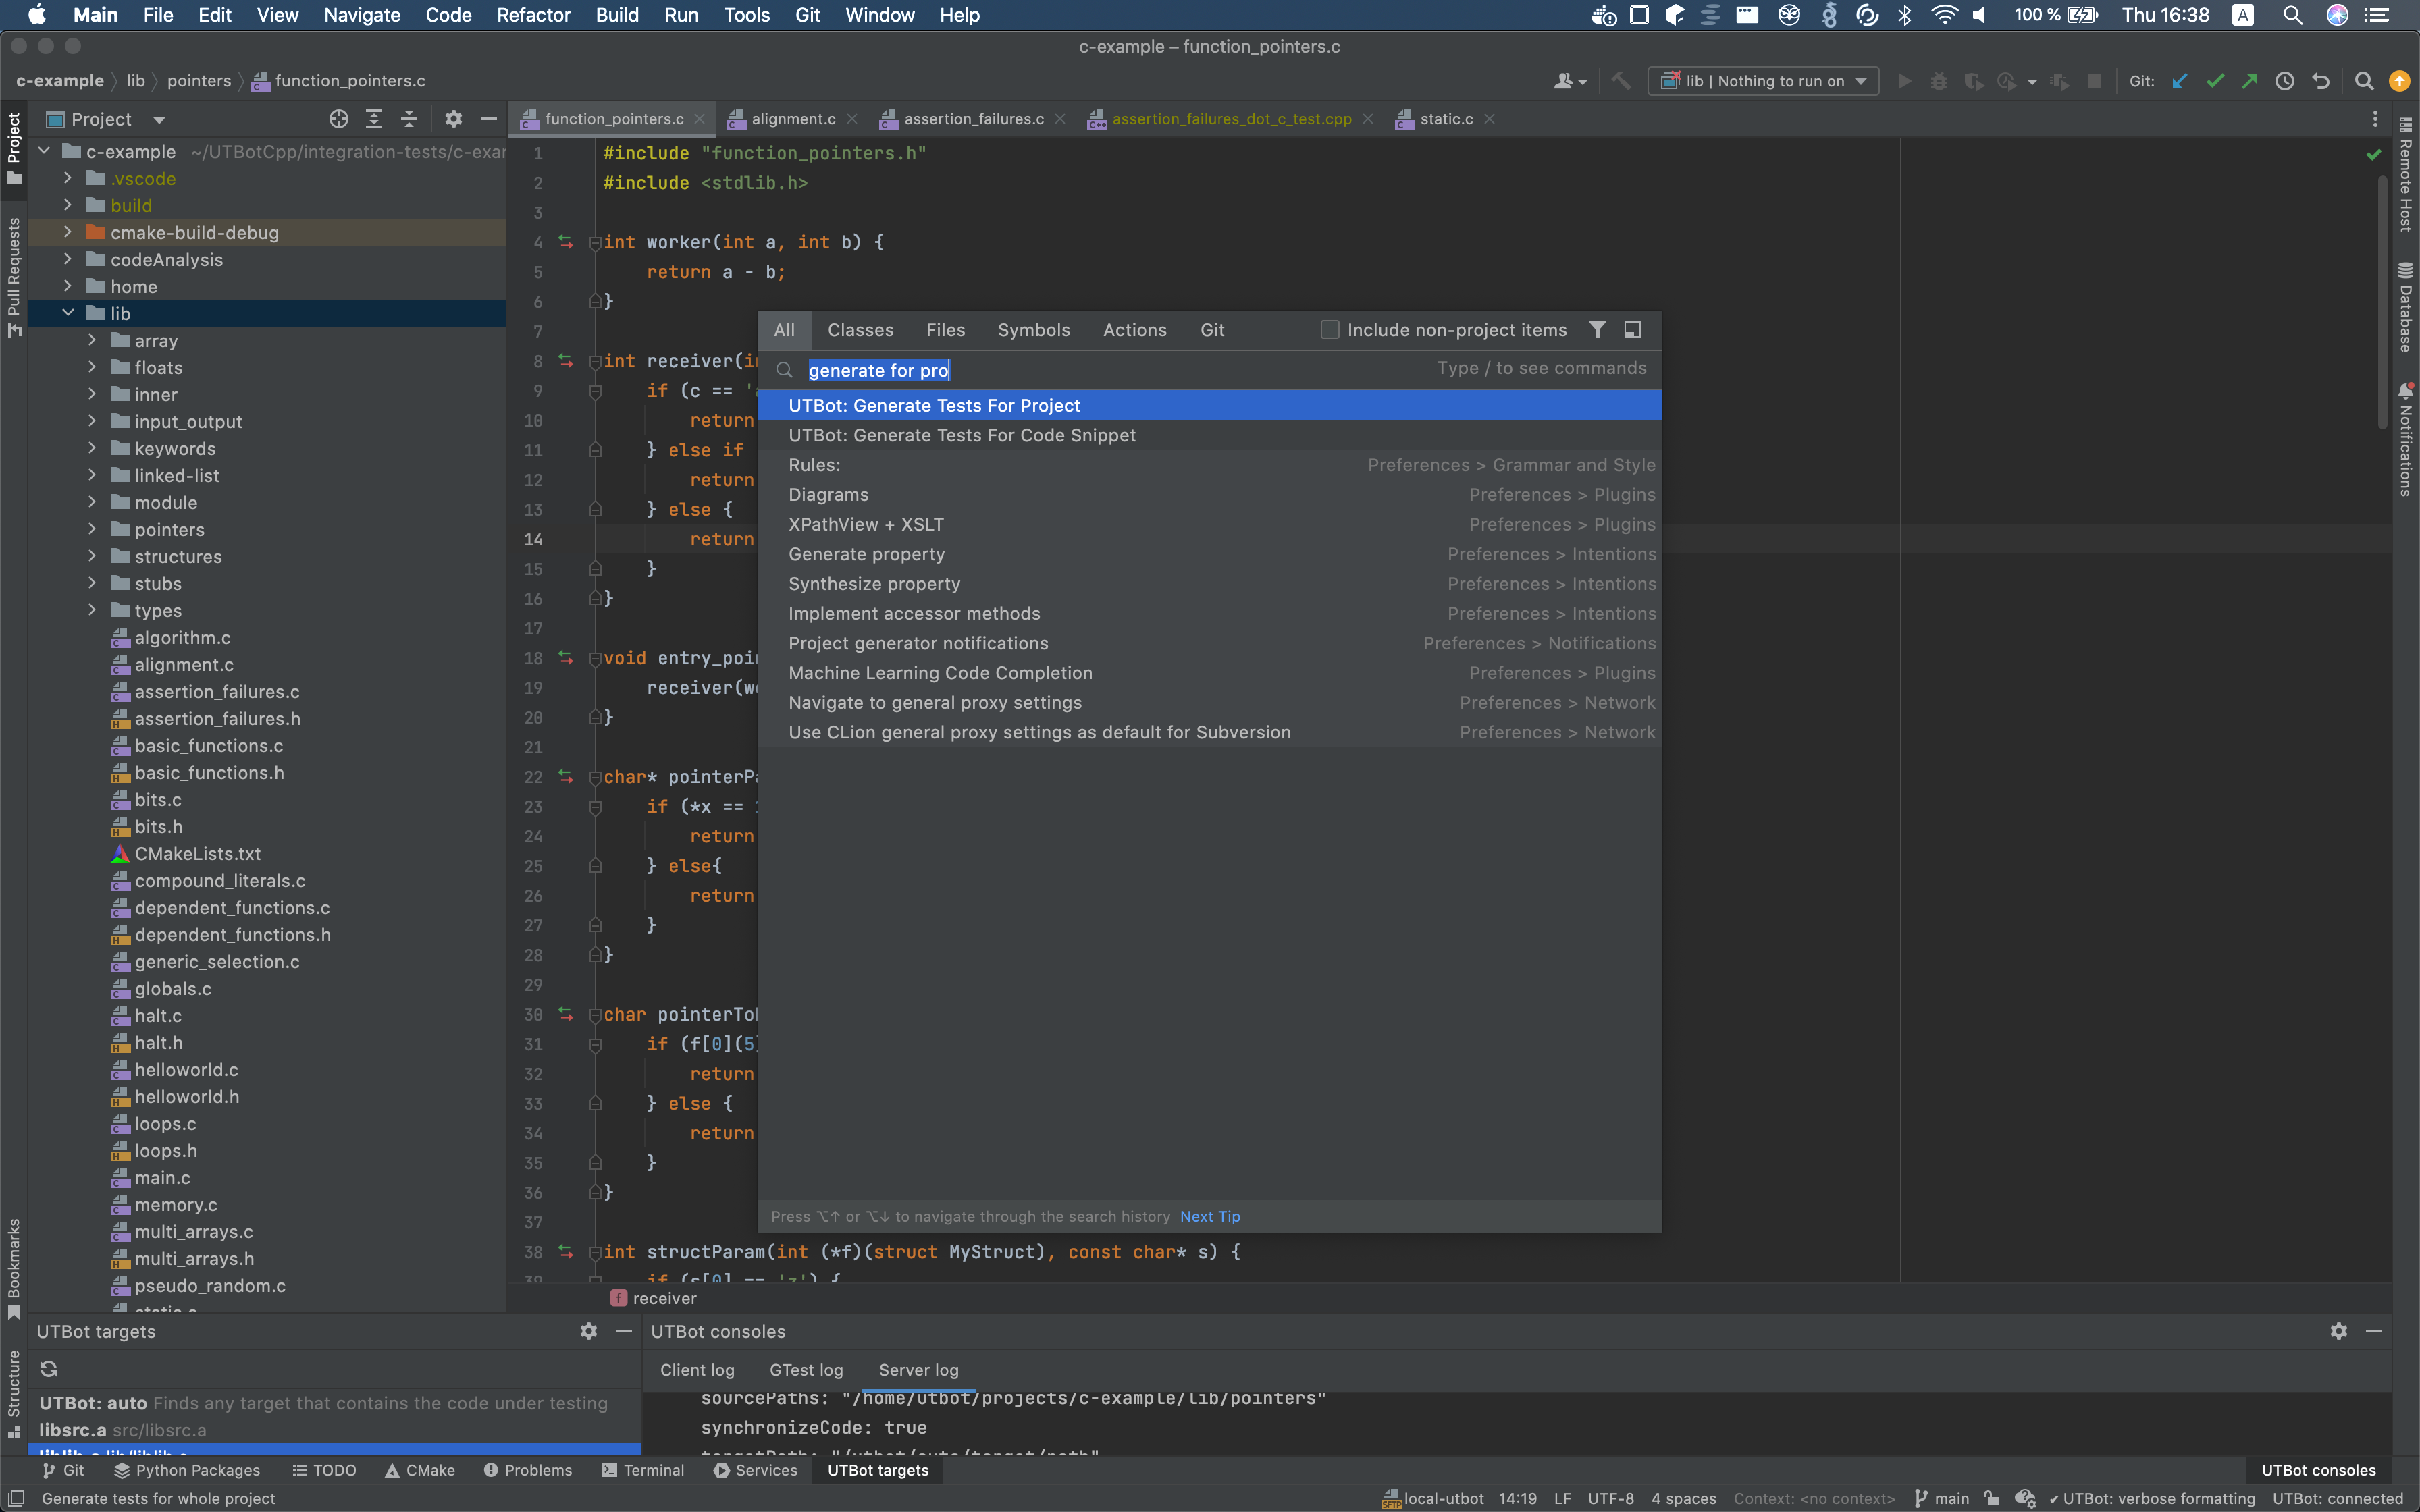
From search window. Open search window by pressing
Shifttwice. Then search for a particular action, for instanceUTBot: Generate For project
Running tests with coverage
Run a single test
How-to steps:
- Open file with generated tests
- Click on the icon located near the test
Run all tests in a file
How-to steps:
- Open file with generated tests
- Click on the icon located near
UTBotnamespace
Run all tests in project
How-to steps:
- Open search window by pressing
Shifttwice - Search for
UTBot: Run All Tests and Show Coverage
Manage coverage
Consider the following scenario: you ran tests A with coverage, and then you run
some other tests B with coverage. Then a dialog with three options will be opened:

It is because there is already coverage displayed
from tests A, and you can choose:
- to merge coverage from
AwithB(Add to active suites) - to replace coverage from
Awith coverage fromB(Replace active suites) - to show coverge only from
A(Do not apply collected coverage)
Plugin settings
You can view and edit available settings in Settings -> Tools -> UTBot Settings
